
Data Illustrates Reduction in Homelessness in Florida
Each Continuum of Care is required to submit to HUD an annual PIT and an annual HIC. This information is available to review.
The Point in Time (PIT) Count is an estimate of the number of homeless individuals on any given day during the last 10 days in January. This data is not an accurate measure of the total number of individuals, but if the CoC uses the same methodology, it provides an overview of the increase or decrease in the number of individuals experiencing homelessness in a community.
The Housing Inventory Chart is a count of the number of shelter beds and permanent housing beds that a CoC has in their community.
Florida Data from these reports:
- There has been a 65% reduction in TH Beds and a 218% increase in PH Beds.
- Even shifting TH to a shorter ES stay and the addition of safe-haven shelters, there is a 15% reduction in the total number of shelter units available in the State
- The 2021 numbers are skewed, not only did 16 of the CoCs not complete a full unsheltered count, but the reduction in sheltered counts is also very high.
- We continue to see 46% of those experiencing homelessness remain unsheltered.
Program Changes
- Introduction of the HEARTH Act – HUD encouraged CoCs to reallocate TH to RRH
- HUD focus on reducing the length of time of shelter – allowing more people to be served on a short-term basis (less need for shelter beds, which may account for the reduction).
- Increase in housing-focused outreach initiatives and housing first strategies
- Supportive Services for Veteran Families Grant – this increased CoC access to Permanent Housing funding (RRH) and increased collaboration with the VA for HUD VASH units – There has been a 58.3% reduction in veterans experiencing homelessness (2007-2020)
- HPRP and ESG-CV Programs, we can also note the recurring Challenge Grant funding from the State (started in 2015)
Florida Point in Time and HIC Data from 2007:
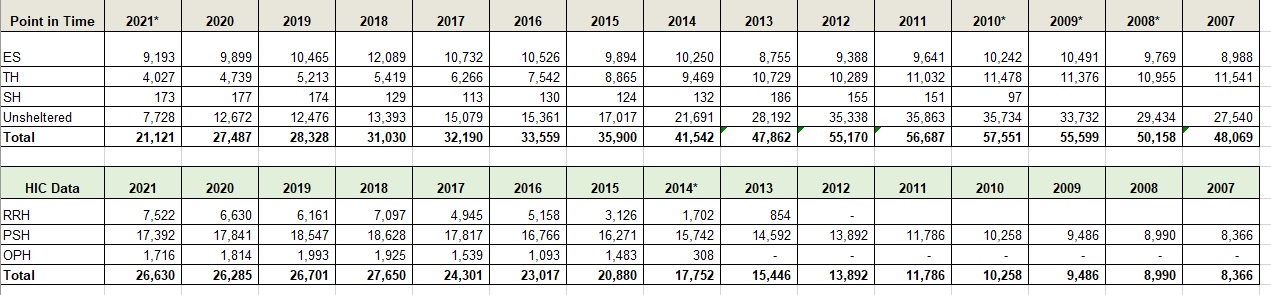
*2021 – Only 16 CoCs reported Unsheltered and 5 of those were a partial count. ESG-CV was awarded in 2020 and affected the 2021 homeless counts
* 2008-2010 – The housing crash occurred in 2008, increasing homelessness in the State. HPRP was introduced in 2010 and affected the 2011-2012 homeless counts
Data Source:
https://www.huduser.gov/portal/sites/default/files/xls/2007-2021-HIC-Counts-by-State.xlsx
https://www.huduser.gov/portal/sites/default/files/xls/2007-2021-PIT-Counts-by-State.xlsx
https://www.huduser.gov/portal/sites/default/files/xls/2007-2021-PIT-Counts-by-CoC.xlsx